Understanding Short Interest Ratios
Short interest ratios are a key metric for traders and investors looking to gauge market sentiment and potential price movements. However, understanding how this data is collected, reported, and interpreted is essential to making informed decisions.
What Is Short Interest?
Short interest refers to the number of shares of a stock that have been sold short but not yet covered or closed out. This is an important indicator of bearish sentiment, as high short interest often suggests that investors expect the stock price to decline.
A high short interest ratio means that it would take longer for short sellers to cover their positions, potentially leading to short squeezes if demand surges.
Understanding FINRA's Bi-Monthly Short Interest Data
The Financial Industry Regulatory Authority (FINRA) provides short interest data on a bi-monthly basis, reporting the total number of shares that have been sold short. While this data is widely used, it comes with limitations:
- Time Lag: The data is typically delayed by several weeks, meaning traders are working with outdated information.
- Reliability Issues: Because the data is retrospective, it does not account for real-time changes in short interest, making it less useful for intraday or short-term traders.
- Float-Based Calculations: Many sites report short interest as a percentage of the float, which can be inaccurate because the float is constantly changing due to share issuance, insider selling, and institutional movements.
Why Using Float Can Be Misleading
Most financial sites compare short interest against their estimates of the stock's float. However, this approach can be unreliable because:
- Companies frequently issue new shares, affecting the float.
- Institutional investors may buy or sell large positions, altering the available float.
- Many sources use outdated or inconsistent float data, leading to discrepancies in reported short interest ratios.
Daily Short Interest Data: A More Timely Alternative
Some platforms provide daily short interest data, offering a more accurate and up-to-date view of short activity. However, even daily data has limitations, particularly when trading volume exceeds the number of shares outstanding. This can make it difficult to distinguish between legitimate short selling and high-frequency trading activity.
How ShortInterestTracker.com Improves Accuracy
At ShortInterestTracker.com, we take a unique approach to short interest calculations:
- Net Volume Analysis: We compare the net short volume to shares outstanding rather than float to get the most precise short interest estimates.
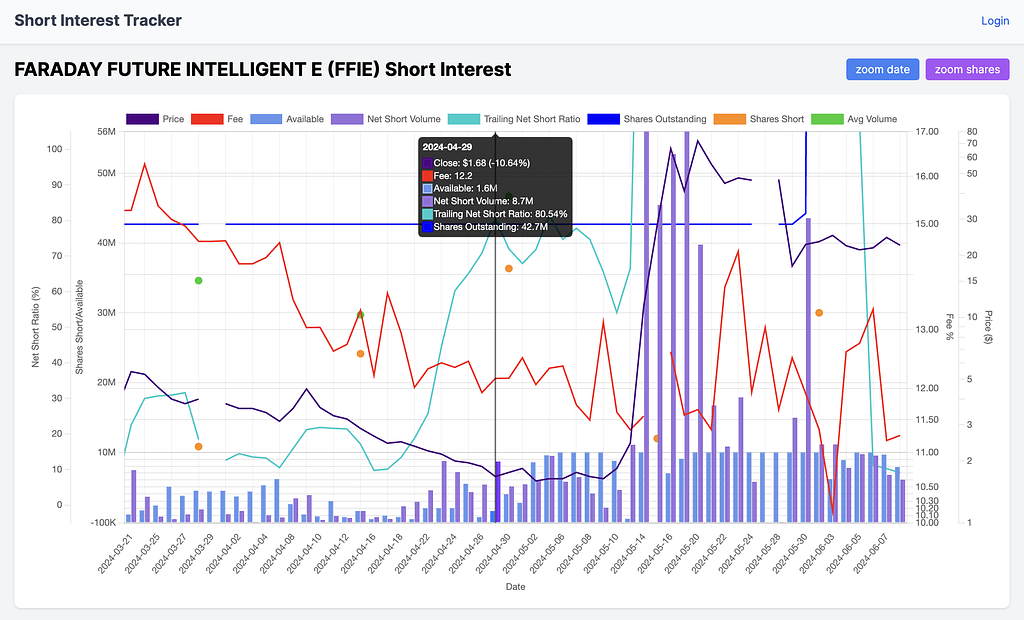
- Trailing 5-Day Window: This allows us to track the accumulation of short positions over time. For example, in May 2024, FFIE had a trailing 5-day short interest of 80%, which was confirmed by FINRA only after a massive short squeeze that led to a 1,000% price increase.
Why Data Accuracy Matters
Since different platforms calculate short interest differently, it's crucial to rely on sources that use the most accurate and transparent methodologies. Using shares outstanding instead of float ensures a clearer picture of short interest trends and prevents misleading interpretations.
Conclusion
Short interest ratios can provide valuable insights into market sentiment and potential short squeezes. However, traders should be aware of the limitations of bi-monthly FINRA data, the inaccuracies of float-based calculations, and the importance of using reliable, up-to-date sources. By leveraging more accurate metrics like daily net short volume and shares outstanding, investors can make better-informed trading decisions.